An Analysis of Republican hypocrisy—Ronald Reagan and beyond
By James Curtis
 Many of us proponents of smaller government, whether Libertarian, Republican, “small L” libertarian, conservative, “constitutionalist,” independent or some other designation, have been very critical of the significant increases in spending and deficit borrowing enacted by the 111th Congress and President Obama. Additionally, many of us were also critical of the spending and borrowing increases enacted during the administration of President George W. Bush. However, many Republicans assert that these examples of fiscal mismanagement are recent phenomena only.
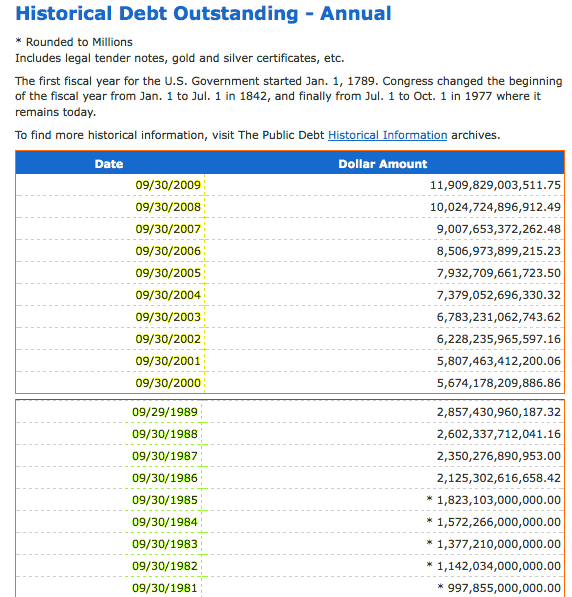
From my analysis, the federal government has seen an explosion in both spending and borrowing over the last 30 years, dating back to the presidency of Ronald Reagan. As a study of the following table demonstrates, federal debt increased by 172% during the Bush administration (fiscal years ending 9/30001 through 9/30/08), but also by a whopping 260% during the Reagan administration (fye 9/30/81 through 9/30/88).
If we agree that the increased debt of the 2000s was an example of fiscal irresponsibility, should we offer the same criticism of the 1980s? I think so.
To be fair, we should adjust for the fact that, due to inflation, a dollar in 2008 did not have the same purchasing power as a dollar in 1988 (setting aside the observation that it is the policies of the Federal Reserve Bank system that inflates and therefore devalues the currency). The following graph depicts the federal debt from 1940 through 2008.
Again, notice the sharp increase beginning in 1981 and continuing through the present.
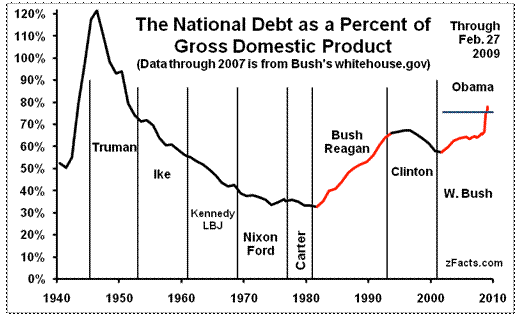
To further put these numbers in context, let’s compare the federal debt to gross domestic product (GDP) for this time frame. As the following graph demonstrates, the debt was actually decreasing from an all time high in 1946 through 1981, when again the percentage began to climb.
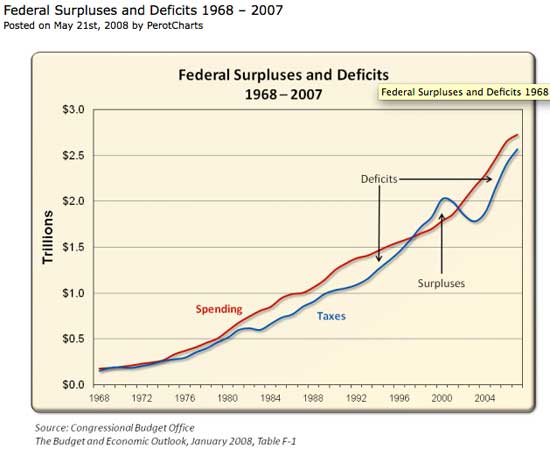
Lastly, the following graph shows that the impetus for budget shortfalls has not been lack of revenue. Specifically, tax revenue has steadily increased from 1968 through 2007, except for some time after the terrorist attacks of 2001.
As these graphs demonstrate, the financial crisis (dare I say “bankruptcy?”) we are experiencing has been a product of the policies of Washington D.C. of the last 30 years, not only the last 8 or 9. There is also evidence that some hope exists, from analysis of the short departure from these trends in the late 1990s. This was the era of the “Republican Revolution” and subsequent Republican control of Congress. To be fair, this was also the age of the “dot com bubble” which created a rapid growth in GDP and tax revenues to coincide with the short period of fiscal restraint.
It is a shame that the era of fiscal responsibility was not replicated in 2001, when Republicans were in the White House and in the majority of both houses of Congress. If Republicans want to truly become a party of “smaller government” or “fiscal responsibility,” it is incumbent on their elected officials and candidates for office to take on a sincere effort to reduce the size of government, namely to reduce federal spending and increases in debt. We need to encourage Rob Bell and others of his generation to do a better job than their predecessors. It’s no longer good enough to be “better than Democrats” the time has come to be better than Republicans, to be good Americans.
Virginia real estate taxation is a sham.
Properties are “reassessed” by local government on a regular schedule, as mandated by state law, most often and historically leading to higher tax bills.
The practice of real estate taxation, generally, insures that no person ever truly owns his property (try not paying real estate taxes and see how long the property remains yours). However, landowners in the Commonwealth are particularly susceptible to fraudulent assessment policies and incompetent or sloppy assessors.
The City of Charlottesville is a prime example of both.
Over the years, allegations of collusion between the City Manager’s office and the Assessor’s office have arisen, and speculation abounds regarding the relationship between the City Manager’s annual stated financial resource “needs” and the historical annual rise in Charlottesville assessments.
In spite of experiencing one of the worst years in decades for local property values, miraculously, average Charlottesville assessments for existing residential property declined by only 2.19%—a figure hardly believable when looking at the dramatic value reductions of Central Virginia residential properties from 2008 to 2009 as indicated by sales statistics.
A report from the regional Multiple Listing Service (MLS) shows that in 2008, the median value of all sold residential properties in Charlottesville was $265,508.
For 2009, the MLS report indicates that the median value for Charlottesville’s sold residential properties fell to $246,500—a drop of 7.2% from the previous year. This number deviates from the Charlottesville Assessor’s figure (down 2.19%) by more than 325%!
How could the Assessor be so disconnected from market reality?
An analysis of selected Charlottesville residential properties (sold from the final quarter of 2009 and into early 2010) netted dozens with substantial over-assessments based on the sales price—two of which were assessed AND taxed at nearly 300% of their eventual sales price. See the chart below:
Mr. Curtis is Treasurer of the Jefferson Area Libertarians, and the 5th Congressional District Chair, Libertarian Party of Virginia.


James Curtis has presented a modern history of spending
and accounting in the United States. As a general point,
it has always been that conservative Republican spending
and taxation are good because they are good people,
Christian people. On the other hand, “left-wing,
San Francisco”, Democrats’ spending and taxation are
bad. I left out the expletives about the Democrats.
If you travel in conservative, Republican circles, I
assume you have heard them. Will this spending through
borrowing and taxation ever decline on the federal level?
While I find myself nodding in agreement with the author, the charts and graphs don’t portray our new level of excessive government spending (enacted and proposed) in a particularly viable fashion.
A more entertaining (and still illustrative) You Tube clip about the national debt can be found here:
http://www.youtube.com/watch?v=P5yxFtTwDcc